Data reshaping is a crucial aspect of data analysis, and Pandas’ pivot_table function is a versatile tool that can transform your data into a more insightful and manageable format. This article will guide you through the nuances of using pivot_table effectively, showcasing its flexibility and power in handling complex data scenarios.
In our previous article, we explored the pivot method in Pandas, a fundamental tool for reshaping data from long to wide format. While pivot is incredibly useful for certain scenarios, it has its limitations, particularly when dealing with duplicate index values. The pivot method is designed for scenarios where each combination of index and column values is unique. When faced with duplicate entries, pivot struggles, as it cannot perform aggregation to resolve these duplicates.
This is where pivot_table comes into play. Pivot_table is an advanced version of pivot, offering greater flexibility and the ability to handle duplicate index values through aggregation. It allows for a more nuanced and accurate representation of your data, making your analysis more robust and reliable. Whether you’re dealing with complex datasets that require aggregation or simply need a more flexible approach to reshaping your data, pivot_table is an invaluable tool in your data analysis toolkit.
Let’s dive into the advanced functionalities of pivot_table and discover how it can enhance your data reshaping and analysis processes.
Understanding Pivot_Table in Pandas
Pivot_table is an advanced version of the pivot method. It’s designed to handle duplicate index values by aggregating them, making it ideal for more complex data reshaping tasks. Unlike the pivot method, which requires unique combinations of index and column values, pivot_table can aggregate data based on specified functions, such as sum, mean, max, and min.
1. Basic Usage of Pivot_Table
Let’s start with a basic example to understand how pivot_table works:
import pandas as pd


# Sample data

data = {

    'Date': ['2021-01-01', '2021-01-01', '2021-01-02', '2021-01-02'],

    'Category': ['Electronics', 'Clothing', 'Electronics', 'Clothing'],

    'Sales': [200, 150, 230, 180]

}


df = pd.DataFrame(data)

print("Original DataFrame (df):")

print(df, end="\n\n")


# Using pivot_table

pivot_table_df = df.pivot_table(index='Date', columns='Category', values='Sales', aggfunc='sum')

print("Pivoted DataFrame (pivot_table_df):")

print(pivot_table_df)
Output:
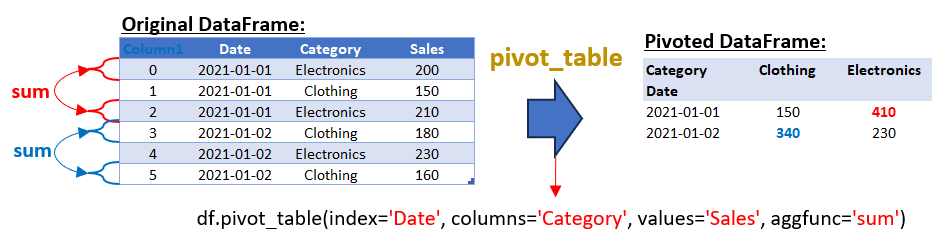
In the provided example, the pivot_table method is used with the aggfunc=’sum’ argument to aggregate the sales values for duplicate combinations in the ‘Date’ and ‘Category’ columns. However, it’s important to note that pivot_table is highly versatile and can use various other aggregate functions depending on your data analysis needs. Here are some common aggregate functions you can use with pivot_table:
- sum: Adds up the values for each group. This is useful for getting total figures, like total sales in our example.
- mean: Calculates the average of the values for each group. This is helpful when you want to find the typical value.
- max: Finds the maximum value for each group. Useful for identifying the highest value in each category.
- min: Identifies the minimum value for each group. This can be used to find the lowest value in each category.
- count: Counts the number of occurrences in each group. This is useful for understanding the frequency of certain categories.
- std: Computes the standard deviation for each group, which is a measure of the amount of variation or dispersion of a set of values.
- var: Calculates the variance for each group, giving you a measure of how much the values in each group vary.
- median: Finds the median value for each group. This is useful when you want to know the middle value, especially when your data has outliers.
- first/last: These functions return the first or last value in each group, respectively.
For example, if you wanted to find the average sales instead of the total, you would modify the aggfunc parameter to mean:
pivot_table_df = df.pivot_table(index='Date', columns='Category', values='Sales', aggfunc='mean')Each of these aggregate functions serves a different purpose and can be chosen based on the specific requirements of your data analysis task.
Handling Missing DataPivot_table can also handle missing data gracefully using the fill_value parameter:
# Handling missing data

pivot_table_filled = df.pivot_table(index='Date', columns='Category', values='Sales', aggfunc='sum', fill_value=0)

print(pivot_table_filled)
2. Multi-Level Aggregation with Pivot_Table
When dealing with complex datasets, sometimes a single level of aggregation isn’t sufficient to capture the nuances in your data. This is where multi-level aggregation comes into play, offering a more granular view of your data.
In the context of the pivot_table function in Pandas, multi-level aggregation means applying different aggregate functions to the same set of data. This approach is particularly useful when you want to summarize your data in multiple ways simultaneously.
Example:
Consider a dataset that includes sales data categorized by date and product category. You might want to know not just the total sales (sum) for each category on each date but also the average (mean) sales. This dual perspective can provide deeper insights, such as understanding the consistency of sales across different days or categories.
Here’s how you can achieve this with multi-level aggregation in Pandas:
import pandas as pd


# Sample data

data = {

    'Date': ['2021-01-01', '2021-01-01', '2021-01-02', '2021-01-02'],

    'Category': ['Electronics', 'Clothing', 'Electronics', 'Clothing'],

    'Sales': [200, 150, 230, 180]

}


df = pd.DataFrame(data)

print("Original DataFrame (df):")

print(df, end="\n\n")


# Multi-level aggregation using pivot_table

pivot_table_multi = df.pivot_table(index=['Date', 'Category'], values='Sales', aggfunc={'Sales': ['sum', 'mean']})


print("Multi-Level Aggregated DataFrame:")

print(pivot_table_multi)
Output:
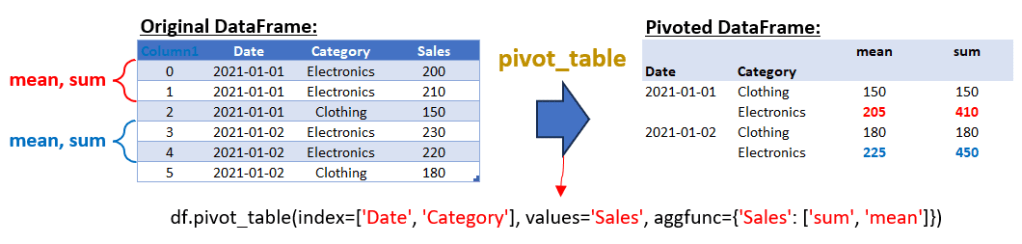
The output of this code will be a DataFrame where each combination of ‘Date’ and ‘Category’ is listed along with two aggregated values for ‘Sales’: the sum and the mean. This multi-level aggregation provides a comprehensive view of the sales data, allowing for a more nuanced analysis. If you want to use the pivot_table function in pandas with more than one column in the values parameter, you can simply pass a list of column names to values. This will perform the specified aggregation functions on each of the columns listed. Here’s an example to illustrate this:
import pandas as pd


# Sample data with an additional 'Profit' column

data = {

    'Date': ['2021-01-01', '2021-01-01', '2021-01-01', '2021-01-02', '2021-01-02', '2021-01-02'],

    'Category': ['Electronics', 'Electronics', 'Clothing', 'Electronics', 'Electronics', 'Clothing'],

    'Sales': [200, 210, 150, 230, 220, 180],

    'Profit': [20, 25, 15, 23, 22, 18]

}


df = pd.DataFrame(data)

print("Original DataFrame (df):")

print(df, end="\n\n")


# Multi-level aggregation using pivot_table with multiple values

pivot_table_multi = df.pivot_table(index=['Date', 'Category'], values=['Sales', 'Profit'], aggfunc={'Sales': ['sum', 'mean'], 'Profit': ['sum', 'mean']})


print("Multi-Level Aggregated DataFrame with Multiple Values:")

print(pivot_table_multi)
Output:
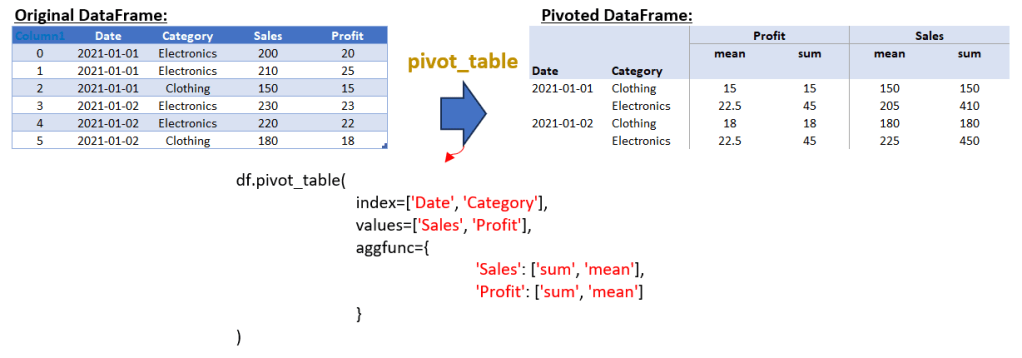
In this script, the DataFrame df includes an additional ‘Profit’ column. The pivot_table function is used with values set to both ‘Sales’ and ‘Profit’. The aggfunc parameter is a dictionary that specifies the aggregation functions (‘sum’ and ‘mean’) to be applied to both ‘Sales’ and ‘Profit’. The resulting DataFrame will show the total and average sales and profit for each combination of ‘Date’ and ‘Category’.
3. Multi-Level Index, Columns, And Values Parameter in Pivot_Table Method
Now, we’ll explore an advanced use of pivot_table that involves multi-level indexing, multiple columns, and multiple values parameters. This technique is particularly useful for analyzing complex datasets with various categorical dimensions.
Understanding the Data Structure
Let’s start with a sample dataset that includes sales and profit data for different categories, regions, and types over various dates. This kind of data is common in business scenarios where you need to analyze performance across multiple dimensions. Here the script for creating DataFrame:
import pandas as pd


# Sample data with an additional 'Type' column

data = {

    'Date': ['2021-01-01', '2021-01-01', '2021-01-01', '2021-01-02', '2021-01-02', '2021-01-02'],

    'Category': ['Electronics', 'Electronics', 'Clothing', 'Electronics', 'Electronics', 'Clothing'],

    'Region': ['North', 'South', 'North', 'South', 'North', 'South'],

    'Type': ['Type1', 'Type2', 'Type1', 'Type2', 'Type1', 'Type2'],

    'Sales': [200, 210, 150, 230, 220, 180],

    'Profit': [20, 25, 15, 23, 22, 18]

}


df = pd.DataFrame(data)

print("Original DataFrame (df):")

print(df, end="\n\n")
Implementing Multi-Level Aggregation with Pivot_Table
The pivot_table function in Pandas allows us to create a multi-dimensional table that’s easy to analyze. We can set multiple columns as indices and also define multiple columns in the columns parameter. This creates a comprehensive table that can be used for in-depth analysis. Here the script to implement multi-level aggregation with pivot_table method:
# Multi-level aggregation using pivot_table with multiple columns in 'columns' parameter
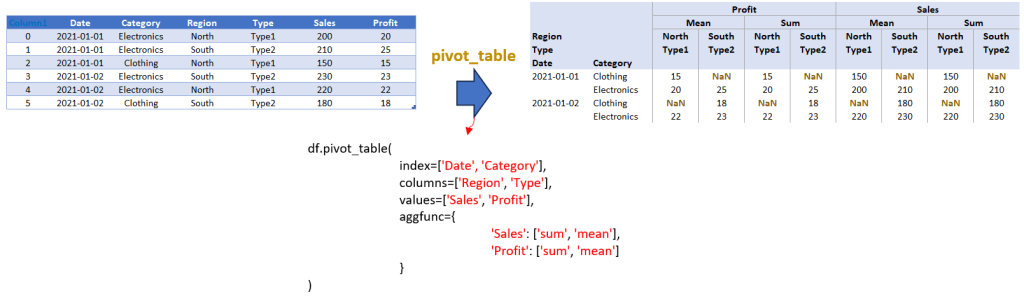
pivot_table_multi = df.pivot_table(index=['Date', 'Category'], columns=['Region', 'Type'], values=['Sales', 'Profit'], aggfunc={'Sales': ['sum', 'mean'], 'Profit': ['sum', 'mean']})
print("Multi-Level Aggregated DataFrame with Multiple Columns in 'columns' Parameter:")
print(pivot_table_multi)
Now, let’s integrate the above script to appear as follows:
import pandas as pd


# Sample data with an additional 'Type' column

data = {

    'Date': ['2021-01-01', '2021-01-01', '2021-01-01', '2021-01-02', '2021-01-02', '2021-01-02'],

    'Category': ['Electronics', 'Electronics', 'Clothing', 'Electronics', 'Electronics', 'Clothing'],

    'Region': ['North', 'South', 'North', 'South', 'North', 'South'],

    'Type': ['Type1', 'Type2', 'Type1', 'Type2', 'Type1', 'Type2'],

    'Sales': [200, 210, 150, 230, 220, 180],

    'Profit': [20, 25, 15, 23, 22, 18]

}


df = pd.DataFrame(data)

print("Original DataFrame (df):")

print(df, end="\n\n")


# Multi-level aggregation using pivot_table with multiple columns in 'columns' parameter

pivot_table_multi = df.pivot_table(index=['Date', 'Category'], columns=['Region', 'Type'], values=['Sales', 'Profit'], aggfunc={'Sales': ['sum', 'mean'], 'Profit': ['sum', 'mean']})


print("Multi-Level Aggregated DataFrame with Multiple Columns in 'columns' Parameter:")

print(pivot_table_multi)
Output:
Analysis and Insights
The resulting DataFrame from the above script is a multi-level aggregated table. It provides a detailed view of sales and profit data, broken down by date, category, region, and type. The use of multiple aggregation functions (sum and mean) for both sales and profit adds further depth to our analysis, allowing us to see both total and average values.
This kind of table is particularly useful in scenarios where you need to analyze trends and patterns across different segments and time periods. For instance, you can easily compare the performance of different product types across regions or see how sales and profits have evolved over time for each category.
Conclusion
The pivot_table function in Pandas is a powerful and versatile tool for reshaping and analyzing complex datasets. As we’ve seen in this article, it allows for advanced data manipulation techniques, including multi-level aggregation, handling multiple columns in both the index and values parameters, and dealing with duplicate index values through various aggregation functions. Whether you’re working with sales data, financial reports, or any other form of structured data, pivot_table offers the flexibility and depth needed for comprehensive data analysis.
From basic usage to more advanced applications, pivot_table enables you to gain deeper insights into your data. It allows for a nuanced view of multi-dimensional datasets, making it easier to identify trends, patterns, and anomalies. By mastering pivot_table, you can elevate your data analysis skills and make more informed decisions based on your data. As we continue to explore the world of data reshaping in Pandas, stay tuned for our next article. We will delve deeper into other aspects of data manipulation and reshaping, providing you with more expert tips and techniques to enhance your data analysis capabilities. So, make sure to follow our series for more insightful content on data reshaping!
