Data reshaping is a fundamental aspect of data manipulation and analysis, especially when working with Pandas in Python. Among the various methods available, the pivot function stands out for its ability to reorganize and reshape data efficiently. This function is particularly useful for creating pivot tables, which are instrumental in summarizing and analyzing large datasets.
The Pivot Method Explained
The pivot method in Pandas transforms data from long to wide format. It turns unique values from one column into multiple columns in the DataFrame, providing a new way of looking at your data. This is particularly useful when you want to examine relationships or patterns that are more apparent in a wide format.
1. Practical Example of Pivot in Pandas
Let’s consider a simple example to understand how the pivot method works. We’ll start by creating a DataFrame and then apply the pivot method to reshape it.
import pandas as pd


# Sample data

data = {

    'Date': ['2021-01-01', '2021-01-01', '2021-01-02', '2021-01-02'],

    'Variable': ['A', 'B', 'A', 'B'],

    'Value': [23, 45, 25, 47]

}


# Creating the DataFrame

df = pd.DataFrame(data)

print("Original DataFrame:")

print(df, end="\n\n")


# Applying the pivot method

pivoted_df = df.pivot(index='Date', columns='Variable', values='Value')

print("Pivoted DataFrame:")

print(pivoted_df)
Output:
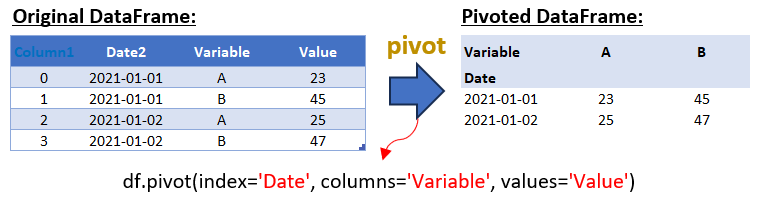
In this example, we have a DataFrame with dates, variables (A and B), and their corresponding values. By applying the pivot method, we restructure the DataFrame so that each unique value in the ‘Variable’ column becomes a separate column in the pivoted DataFrame.
2. Advanced Pivot: Multiple Values Columns
Pandas’ pivot function also allows for more complex reshaping with multiple values columns. This can be particularly useful when dealing with multifaceted data that requires a more nuanced approach to reshaping.
Here’s an example of how to pivot a DataFrame with more than one column in the values parameter:
import pandas as pd


# Sample data

data = {

    'Date': ['2021-01-01', '2021-01-01', '2021-01-02', '2021-01-02'],

    'Variable': ['A', 'B', 'A', 'B'],

    'Value': [23, 45, 25, 47],

    'Additional_Value': [5, 6, 7, 8] # Additional data for the example

}


# Creating the DataFrame

df = pd.DataFrame(data)

print("Original DataFrame with Additional Values:")

print(df, end="\n\n")


# Applying pivot with multiple values columns

pivoted_df = df.pivot(index='Date', columns='Variable', values=['Value', 'Additional_Value'])

print("Pivoted DataFrame with Multiple Values Columns:")

print(pivoted_df)Output:
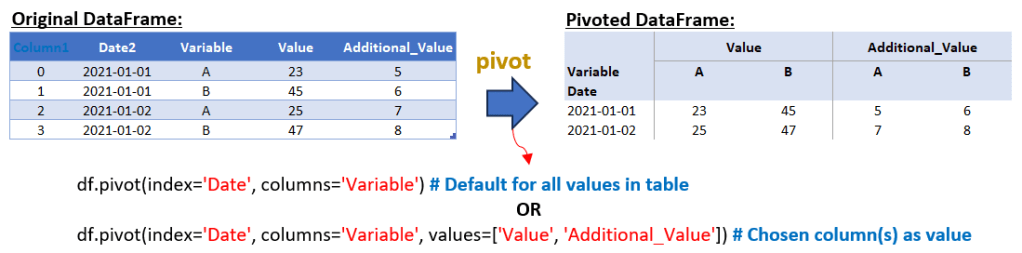
In this extended example, we added an ‘Additional_Value’ column to our DataFrame. When we apply the pivot method this time, we omit the values parameter, allowing Pandas to create a multi-level column DataFrame. This results in a more complex pivoted DataFrame where each variable (A and B) now has two columns – one for ‘Value’ and another for ‘Additional_Value’.
From the script above, you can use one of these formats for the pivot method in pandas:
- df.pivot(index=’Date’, columns=’Variable’): When the values parameter is not specified, pandas includes all other columns in the DataFrame as values. If there are multiple columns in the DataFrame besides ‘Date’ and ‘Variable’, the resulting pivoted DataFrame will have hierarchical column headers (multi-level columns). The top level of these headers corresponds to the unique values from the ‘Variable’ column, and the second level corresponds to the names of the other columns.
- df.pivot(index=’Date’, columns=’Variable’, values=[‘Value’, ‘Additional_Value’]): This format allows you to specifically choose which columns to use as values in the pivoted DataFrame. By specifying values=[‘Value’, ‘Additional_Value’], you’re indicating that only the ‘Value’ and ‘Additional_Value’ columns should be used to fill in the new DataFrame. The resulting DataFrame will have hierarchical column headers similar to the first format, but only with the specified columns as the second level.
3. Advanced Pivot: Multiple Columns
When dealing with a DataFrame where you need to pivot on more than one column, Pandas offers flexible options to reshape your data. Let’s delve into an example where we pivot a DataFrame using multiple columns. This approach is particularly useful when your data has several categorical variables that you want to analyze simultaneously.
Scenario:
Suppose you have a dataset that includes dates, two different categorical variables (like ‘Variable1’ and ‘Variable2’), and their corresponding values. You want to pivot this data to analyze the interactions between these two variables over different dates.
Example:
import pandas as pd
# Sample data
data = {
'Date': ['2021-01-01', '2021-01-01', '2021-01-02', '2021-01-02', '2021-01-01', '2021-01-01', '2021-01-02', '2021-01-02'],
'Variable1': ['A', 'A', 'A', 'A', 'B', 'B', 'B', 'B'],
'Variable2': ['X', 'Y', 'X', 'Y', 'X', 'Y', 'X', 'Y'],
'Value': [23, 30, 25, 35, 45, 50, 47, 55]
}
# Creating the DataFrame
df = pd.DataFrame(data)
print("Original DataFrame:")
print(df, end="\n\n")
# Applying the pivot method with multiple columns
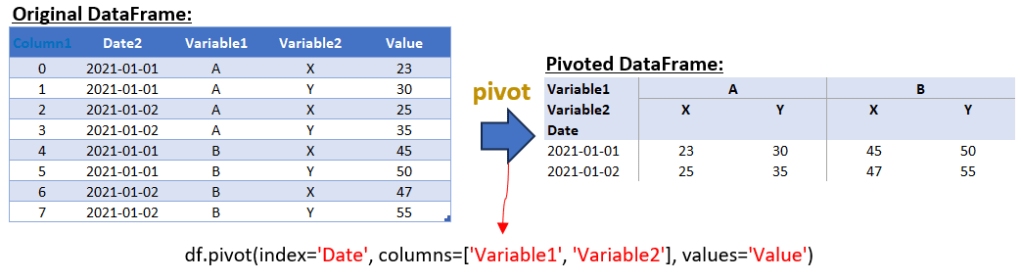
pivoted_df = df.pivot(index='Date', columns=['Variable1', 'Variable2'], values='Value')
print("Pivoted DataFrame with Multiple Columns:")
print(pivoted_df)
Output:
Explanation:
In this example, we have two categorical variables, ‘Variable1’ and ‘Variable2’, along with their corresponding ‘Value’. By using the pivot method, we set ‘Date’ as the index, and both ‘Variable1’ and ‘Variable2’ as columns. This creates a multi-level column structure in the pivoted DataFrame, allowing us to observe the interactions between ‘Variable1’ and ‘Variable2’ across different dates.
Output Structure:
The resulting DataFrame will have a hierarchical column structure where the first level corresponds to ‘Variable1’ and the second level to ‘Variable2’. Each cell in the DataFrame represents the ‘Value’ for the combination of ‘Date’, ‘Variable1’, and ‘Variable2’.
This approach to pivoting with multiple columns is particularly powerful for multi-dimensional data analysis, enabling a comprehensive view of complex datasets. It allows for a deeper exploration of the relationships and patterns that exist within the data, which might not be immediately apparent in a simpler, flat structure.
4. Advanced Pivot: Multi-Level Indexing
In the realm of data manipulation using pandas, mastering the art of multi-level indexing can significantly enhance your data analysis capabilities. This technique is particularly useful when you need to pivot your data using more than one column as the index. By passing a list of column names to the index parameter in the pivot operation, you create what is known as a hierarchical or multi-level index in your resulting DataFrame. Each level of this index corresponds to one of the columns you specify, allowing for a more nuanced and detailed data structure.
Let’s delve into an example to demonstrate this powerful feature:
import pandas as pd


# Sample data representing dates, times, and values for two variables (A and B)

data = {

    'Date': ['2021-01-01', '2021-01-01', '2021-01-02', '2021-01-02'],

    'Time': ['08:00', '09:00', '08:00', '09:00'],

    'Variable': ['A', 'B', 'A', 'B'],

    'Value': [23, 45, 25, 47]

}


# Creating a DataFrame from the sample data

df = pd.DataFrame(data)

print("Original DataFrame:")

print(df, end="\n\n")


# Using the pivot method to reorganize the DataFrame.

# The 'Date' and 'Time' columns are used as a multi-level index.

# The 'Variable' column values are transformed into column headers.

# The 'Value' column provides the data for the new DataFrame.

pivoted_df = df.pivot(index=['Date', 'Time'], columns='Variable', values='Value')

#pivoted_df.reset_index(inplace=True)

print("Pivoted DataFrame with Multi-Level Index:")

print(pivoted_df)
Output:
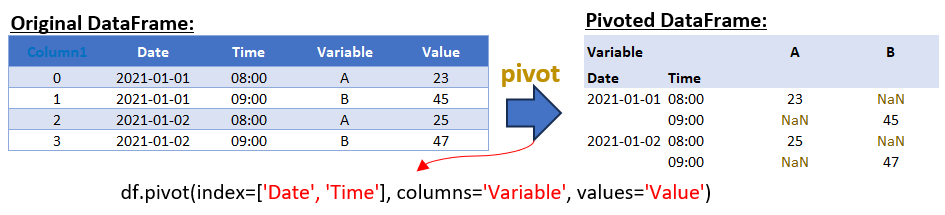
In this example, we use both ‘Date’ and ‘Time’ as indices. The resulting DataFrame showcases a hierarchical index with two levels – the first level being ‘Date’ and the second ‘Time’. The ‘Variable’ column values are transformed into column headers, while the ‘Value’ column populates the DataFrame cells.
To further refine this DataFrame:
- pivoted_df = df.pivot_table(index=[‘Date’, ‘Time’], columns=’Variable’, values=’Value’, fill_value=0) – This modification fills any NaN values with 0, ensuring a complete dataset without missing values.
- pivoted_df.reset_index(inplace=True) – If you prefer to see the ‘Date’ values repeated for each row, resetting the index is the way to go. This action converts the multi-level index into regular columns, making the ‘Date’ and ‘Time’ values visible for each corresponding row.
Conclusion
The pivot function in pandas is a powerful tool for reshaping data, transforming it from a long format to a wide format. It’s particularly useful when you need to reorganize data so that certain column values become column headers, making the data more accessible for analysis or reporting. However, it’s crucial to understand the limitations and appropriate use cases for the pivot function.
One key limitation of the pivot function is its inability to handle duplicate index values. This function is specifically designed for scenarios where each combination of the index and column values is unique. In cases where your data might have duplicates in the index-column pairs, using pivot directly will result in an error. This is because pivot cannot perform any form of aggregation to resolve these duplicates.
If your dataset includes duplicate index values and you still wish to reshape it, you have two main options:
- Manual Aggregation Before Pivoting: Before applying the pivot function, you can manually aggregate your data using groupby and an aggregation function (like mean, sum, max, etc.) to ensure that each index-column combination is unique.
- Using pivot_table Function: An alternative, and often more straightforward approach, is to use the pivot_table function. This function is specifically designed to handle duplicate index values by automatically aggregating them. It offers a more flexible way to reshape your data, especially when dealing with duplicates.
In the next article, we will delve into the pivot_table function, exploring how it elegantly handles scenarios with duplicate index values and offers additional functionalities that are not available with the basic pivot function. So, stay tuned for a more in-depth look at pivot_table and how it can be a game-changer for your data manipulation tasks in pandas.
