To do VLOOKUP like in excel, python’s built-in class DataFrame has a very detailed and handy method by using map() and merge() functions to merge two different data tables. The merge() function does the same job as the join in SQL and uses the left join to emulate the VLOOKUP function like in Excel (If the 1st dataframe rows are not matched in the 2nd dataframe then the value will be filled by NaN). The map() function allows us to map values to a pandas series or dataframe column, by using a dictionary, pandas series, or dataframe, for more detail let’s see the script samples below:
The map() function
Example-01:
- The first table will be wrapped by df_tbl1 DataFrame that consists of user_id and name columns
- The second table will be wrapped by df_tbl2 DataFrame that consists of user_id (corresponding to df_tbl1 user_id) and salary columns
- Set index for df_tbl1 and df_tbl2 dataframe that corresponding
- Add salary column to first table (df_tbl1) by using map() function
Script-01:
import pandas as pd

df_tbl1 = pd.DataFrame({
    'user_id': ['112', '118', '113', '121', '123'],
    'name': ['Danny', 'Andi', 'Jacky', 'Jeane', 'Jasmin']
})

df_tbl2 = pd.DataFrame({
    'user_id': ['118', '121', '123'],
    'salary': [2000, 3000, 6000]
})

df_tbl1.set_index('user_id', inplace=True)
df_tbl2.set_index('user_id', inplace=True)

df_tbl1['salary'] = df_tbl1.index.map(df_tbl2['salary'])

df_tbl1
Output-01:

Example-02:
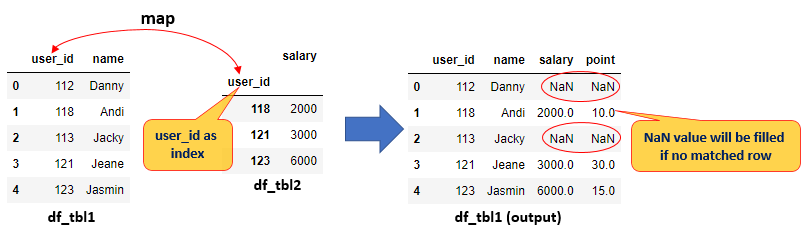
- Or you can map from the selected column in the first table (df_tbl1 dataframe) to key/index in the second table (df_tbl2 dataframe)
- The first table will be wrapped by df_tbl1 DataFrame that consists of user_id and name columns
- The second table will be wrapped by df_tbl2 DataFrame that consists of user_id (corresponding to df_tbl1 user_id) and salary columns
- Set index for df_tbl2 dataframe
- Add the salary and point column to the first table (df_tbl1) by using the map() function
Script-02:
import pandas as pd

df_tbl1 = pd.DataFrame({
    'user_id': ['112', '118', '113', '121', '123'],
    'name': ['Danny', 'Andi', 'Jacky', 'Jeane', 'Jasmin']
})

df_tbl2 = pd.DataFrame({
    'user_id': ['118', '121', '123'],
    'salary': [2000, 3000, 6000],
    'point': [10, 30, 15]
})

df_tbl2.set_index('user_id', inplace=True)

df_tbl1['salary'] = df_tbl1['user_id'].map(df_tbl2['salary'])
df_tbl1['point'] = df_tbl1['user_id'].map(df_tbl2['point'])

df_tbl1
Output-02:
Example-03:
- Update birth month from a dictionary
- Let’s hold the table to update in df_tbl1 dataframe
- Update birth_month column in df_tbl1 dataframe
Script-03:
import pandas as pd

birth_month_map = {
    'Jan': 'January',
    'Feb': 'February',
    'Mar': 'March',
    'Aug': 'August'
}

df_tbl1 = pd.DataFrame({
    'user_id': ['112', '118', '113', '121', '123'],
    'name': ['Danny', 'Andi', 'Jacky', 'Jeane', 'Jasmin'],
    'birth_month': ['Feb', 'Feb', 'Aug', 'Jan', 'Aug']
})

df_tbl1['birth_month'] = df_tbl1['birth_month'].map(birth_month_map)

df_tbl1
Output-03:

The merge() function
Example-04:
- Combine multiple columns and also with multiple key
- df_tbl1 will hold the pandas dataframe with columns: Date, TowerID, Availability, SSSR (the keys are Date and TowerID)
- df_tbl2 will hold the pandas dataframe with columns: Date, TowerID, SARR, DL_SE (the keys are Date and TowerID)
- df_result will hold pandas dataframe result from merge df_tbl1 and df_tbl2
Script-04:
import pandas as pd

df_tbl1 = pd.DataFrame({
    'Date': ['2022-11-25', '2022-11-26', '2022-11-27', '2022-11-25', '2022-11-26', '2022-11-27'],
    'TowerID': ['JAW-KDS-0026', 'JAW-KDS-0026', 'JAW-KDS-0026', 'JAW-BRB-0933', 'JAW-BRB-0933', 'JAW-BRB-0933'],
    'Availability': [100, 100, 100, 99.39, 100, 98.73],
    'SSSR': [98.37, 98.88, 98.84, 93.93, 92.38, 91.33]
})

df_tbl2 = pd.DataFrame({
    'Date': ['2022-11-25', '2022-11-26', '2022-11-27', '2022-11-25', '2022-11-26', '2022-11-27', '2022-11-25', '2022-11-26', '2022-11-27'],
    'TowerID': ['JAW-KDS-0026', 'JAW-KDS-0026', 'JAW-KDS-0026', 'JAW-BRB-0933', 'JAW-BRB-0933', 'JAW-BRB-0933', 'JAW-DPS-3342', 'JAW-DPS-3342', 'JAW-DPS-3342'],
    'SARR': [0.09, 0.08, 0.07, 0.23, 0.77, 0.1, 0.22, 0.23, 0.21],
    'DL_SE': [50.55, 60.00, 55.34, 60.34, 56.32, 58.88, 45.55, 44.34, 46.70]
})

df_result = pd.merge(df_tbl1, df_tbl2, left_on=['Date', 'TowerID'], right_on=['Date', 'TowerID'], how='left')
Output-04:

Summary
Python’s built-in class DataFrame is incredible to emulate the VLOOKUP function by using map() and merge() functions.
If you want to know how to read excel or CSV file and convert it to pandas DataFrame, you can refer to the below link:
